
CUSTOMIZE SPC ANALYSIS WITH MINITAB
During our twenty years’ experience as a provider of solutions for analysis and visualization of data, our customers have asked us to develop solutions that would respond to specific business needs. The developed projects range from simple data analysis, and report development, to complex applications such as the design of business Databases, the company’s system connection to the Web and generating real-time reports.
Customers have specific needs, for example: managing data in different formats, generating statistical reports automatically, using company templates for reports, standardizing algorithms, other time they simply don’t’ want to teach statistics to every person who needs to use Minitab.
We develop together with customers, directly based on their needs, an interface for quality analysis. It is a complete product, at the end of the project the customer will be able to add new statistics in their analysis by themselves. Every application is different from the others, because first of all we listen to customers’ requests.
If you want:
Query on Corporate Databases
Reporting
Operator Interface for Data Collection
Statistical Analysis with Minitab
If you want them, we can build it
We are able to realize applications based on customer specifications, for creating custom reports using Minitab.
If you have:
Data in different formats
Data not in a specific folder
If you want to:
Generate statistical reports automatically
Use a company template
Standardize, schedule reports and algorithms
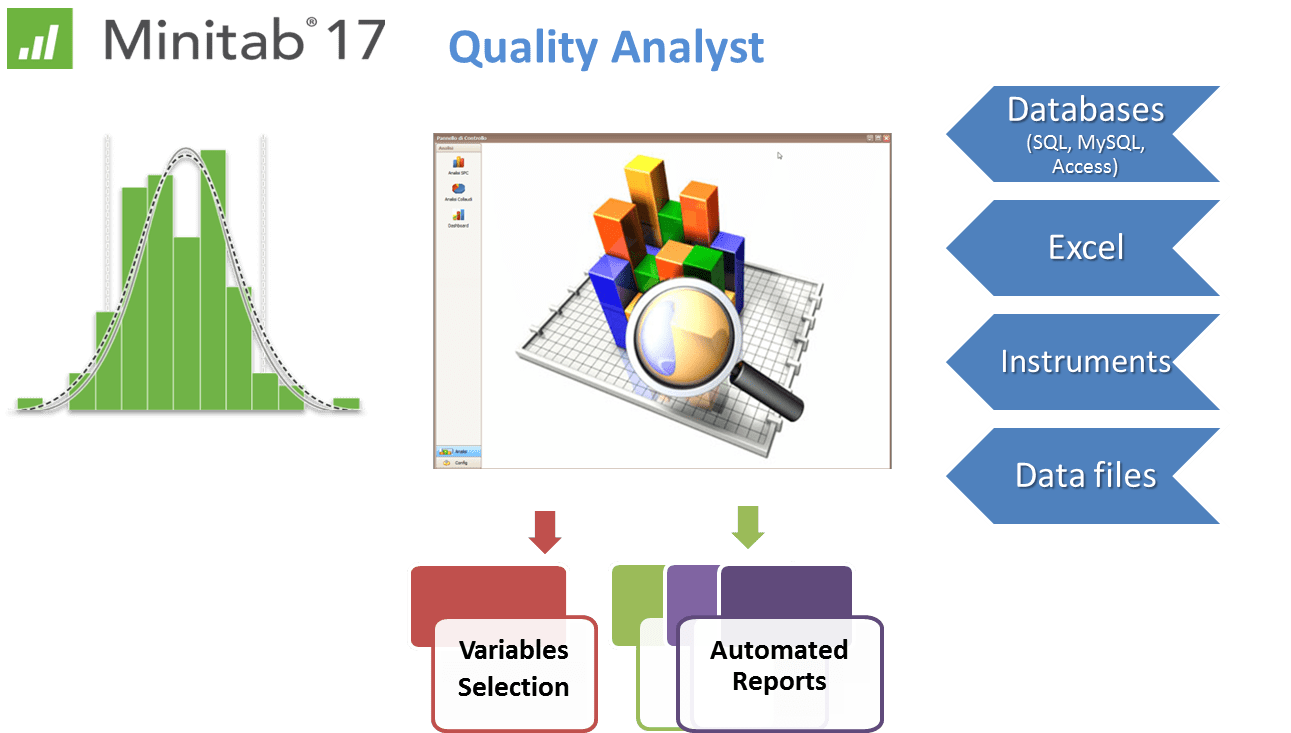
You can use our Quality Analist!
We design your database, or we use your
We populate the database in an automatic way using different sources files
You don’t need to call us if you need to add new algorithms, or new statistics
You can decide where your reports are stored, in which format are them and also if you want them in near-real-time
The application Watchfiles monitors each time that a measurement file is generated in the directory and tranfers the data into the Database
The customer can insert new algorithm directly
The customer could decide to create group of analysis
The customer could assign a group of analysis to each variable
There are different ways to see the analysis :
Report generated as PDF using a customer template
Planning Automatic Report – Scheduler
Slide Show to see the results in Near Real Time on the company Monitor
Contact our team for more information or to schedule a free consultation.
And remember that we are able to provide:
Web demo of some projects we have developped
Little example using customer’s subset of data